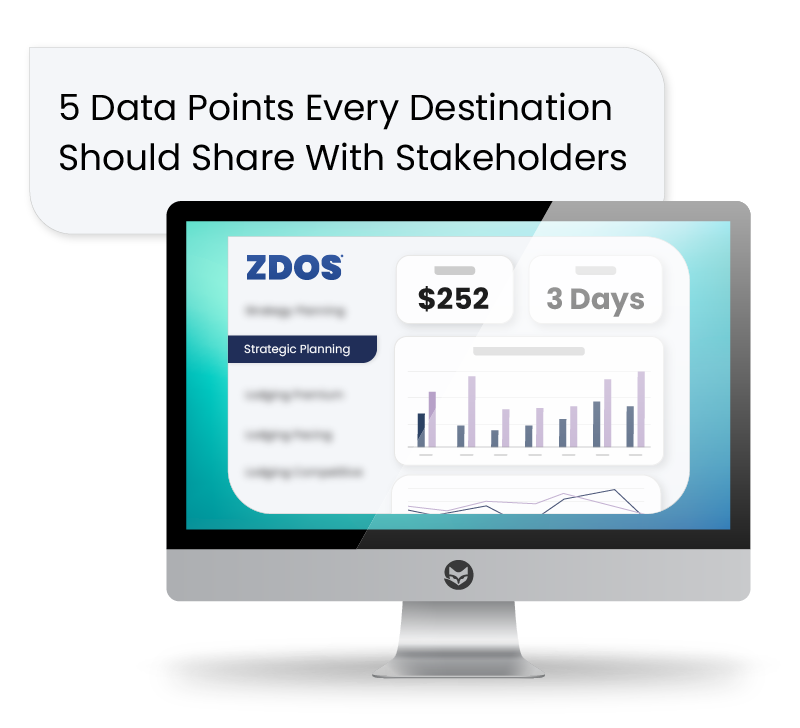
5 Data Points Every Destination Should Share With Stakeholders

Data Points Listicle Images_ZDOS Listicle Intro Image

Data opens doors. Advanced insights create gateways to new destination marketing and management opportunities fueled by hyper-localized visitor trends. 

And savvy destination leaders know data is not a secret to be locked away. Maintaining an open-door policy when it comes to your data — freely and regularly sharing it with community stakeholders — is key to maximizing its value.

Sharing data draws attention to the destination organization’s efforts to drive quality visitation and create positive community impact. But with so much available, it can be challenging to know where to start.

Based on Zartico’s work with 250+ North American destinations, we recommend focusing on insights that support your narrative about the value of tourism to your community. 

Include these data points in your stakeholder reports to invite powerful community conversations.

Data Points Listicle Images_ZDOS Listicle - 1. Share of Visitors

1. Share of visitors 

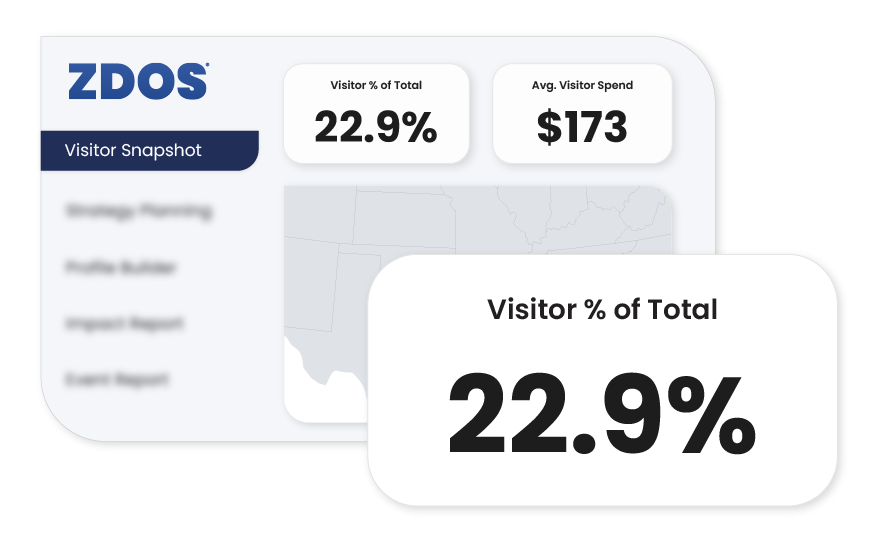
Of all the people in your community — driving on your roads, walking down your sidewalks, entering and exiting buildings, parks, or homes — how many are locals, and how many are visitors?

Communicating your destination’s mix of visitors and residents offers a first glimpse into the impact of your visitor economy. Unlike a visitor volume total, which is often used for little more than making headlines, focusing on the share of visitors allows for deeper investigation.

  • Consider how the balance of visitors and residents shifts over time. 
  • Dig in to see what portion are daytrippers versus overnight visitors. 
  • Apply your unique destination lens to understand the makeup of your visitors — is your destination a hub for commuters or culture? A day trip stop or a week-long getaway?
  • Examine visitor-to-resident ratios in key neighborhoods to monitor compression or create dispersion strategies.

ZDOS® Tip: Find “Visitor % of Total” at the top of the Visitor Snapshot module. Open the Impact Report module to find share of overnight visits, and see visitor-to-resident ratios in the Movement module.

Data Points Listicle Images_ZDOS Listicle - 2. Spending Contr. By Visitors

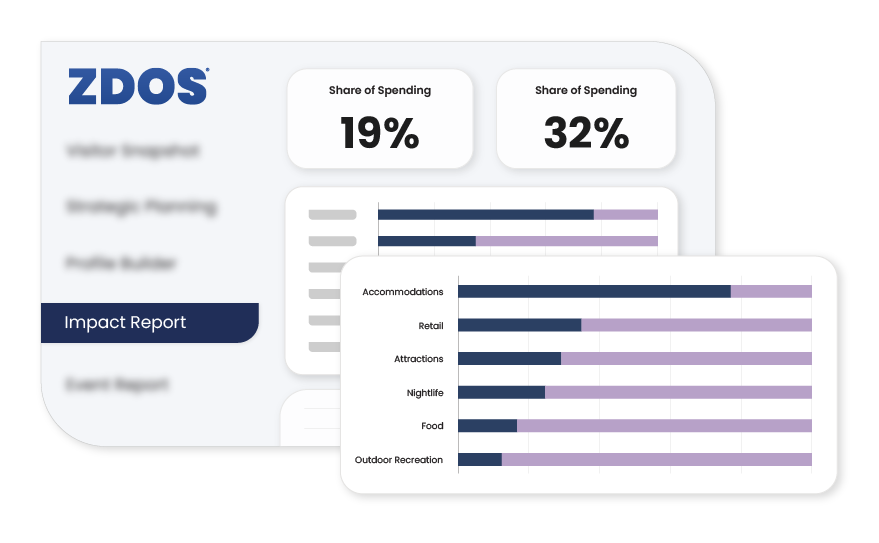
2. Spending contributed by visitors 

Economic impact represents the bottom line of your local tourism industry. It’s where all the arrivals, tours, and itineraries become dollars and cents. 

But like visitor volume totals, large economic impact figures can fail to make your case, especially among stakeholders who are deeply invested in a single sector such as food or retail.

Communicate visitor spending as a percentage of total spending to highlight the impact of visitation in a way stakeholders can immediately understand. For example, by sharing that 20% of spending is contributed by visitors, it’s easy to imagine what might happen if one-fifth of local revenue were to disappear overnight.

Customize your reporting to your audience to make it more tangible. Focus on visitor contributions to restaurants when you report to your restaurant association, and incorporate stats about retail for the chamber of commerce.

ZDOS® Tip: Find “Visitor Spend % of Total” at the top of the Visitor Snapshot module, then scroll down to see stats specific to restaurants, retail, accommodations, and attractions. Find 12-month trends for even more categories in the Impact Report module. Z-Light users can find visitor contributions by category in the Visitor Economy module.

Data Points Listicle Images_ZDOS Listicle - 3. Visitor Spendsing Metrics

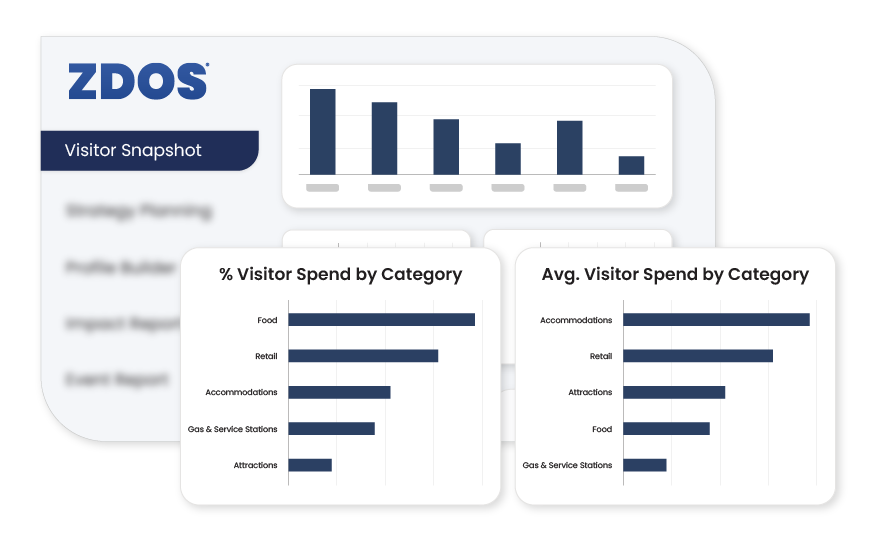
3. Visitor spending metrics

To consider visitor impact from a slightly different angle, look at average visitor spending overall and by category. 

For example, knowing the average visitor spends $120 on retail offers hints to whether they’re browsing the souvenir shops or high-end boutiques. Seeing that visitors are spending a growing share of their dollars on food could point to emerging opportunities for promoting culinary travel.

Reporting on these details is another way to add context to your destination strategy and emphasize the value of visitors to the community.

ZDOS® Tip: Unpack visitor spending by category in the Visitor Snapshot module. Z-Light users can find discretionary spending insights in the Visitor Economy module.

Data Points Listicle Images_ZDOS Listicle - 4. Origin Market Performance

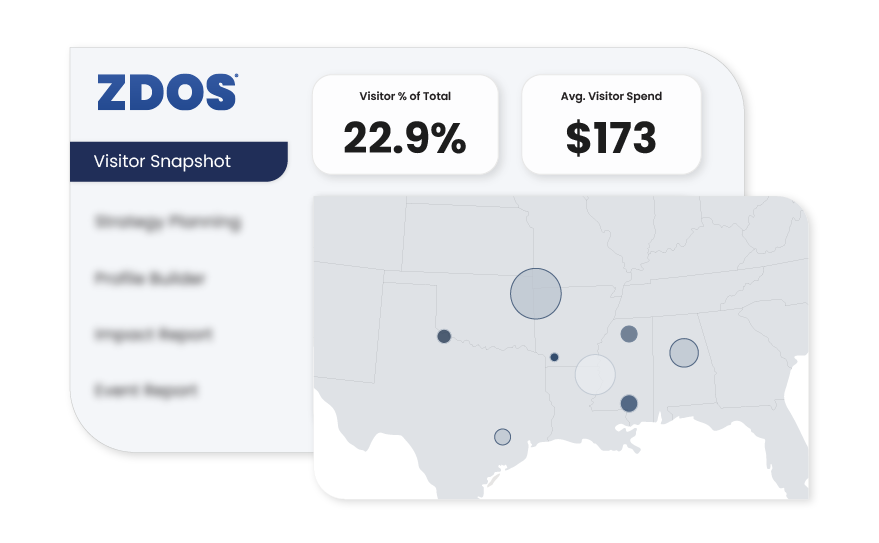
4. Origin market performance

For destination organizations, their agencies, and boards, understanding where visitors are coming from — and how the visitor makeup changes over time — is the first step in targeting and attracting quality visits that will have an overall positive impact on the community.

Share this data with stakeholders to provide tools to make their own decisions about everything from where to run their social media campaigns to which sports team merchandise to stock in their boutiques.

ZDOS® Tip: See your top 10 visitor origin markets in the Impact Report module. Cross-reference this list with the Quality Visit Index in the Profile Builder module to see how these markets align across multiple quality metrics. Find a bubble map of your top markets in Visitor Snapshot, or for Z-Light users, in the Visitor Origins module.

Data Points Listicle Images_ZDOS Listicle - 5. Lodging Performance

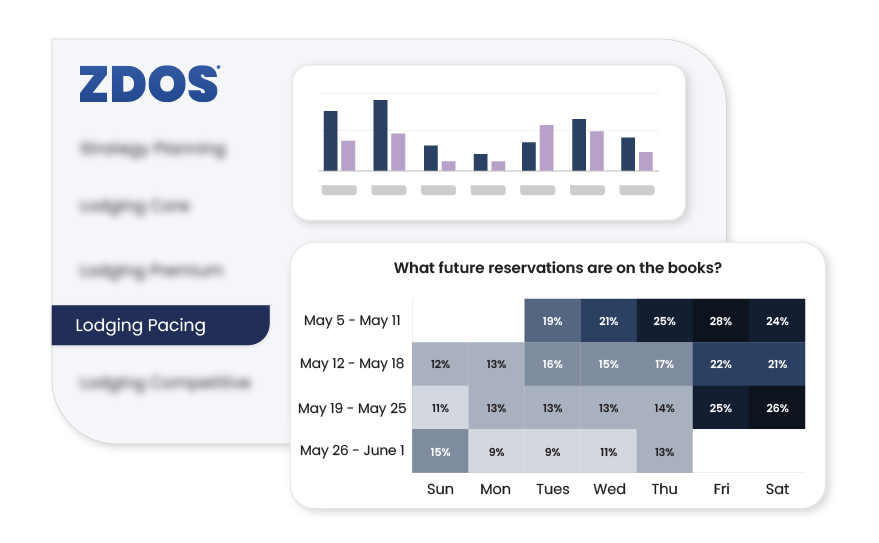
5. Lodging performance

Lodging taxes are the primary source of funding for most U.S. destination organizations. Lodging success supports expanded destination promotion and the overall health of your visitor economy. 

Start with foundational trends in lodging demand, then layer on context such as stay value and length of stay to recruit stakeholder support in driving quality visitation.

But don’t stop there — include metrics with the power to influence change. Future pacing patterns reveal opportunities for marketing pushes or pullbacks or even the need to staff up at local businesses in advance of busy periods. Seeing which feeder markets drive overnight demand illuminates the visitors truly influenced by destination efforts, rather than those visiting relatives or planning day trips.

ZDOS® Tip: Subscribers to Zartico Lodging Data can find advanced lodging performance metrics in the Lodging: Core module. Dig into stats by feeder market, competitive insights, and future bookings in our other premium lodging modules.

Continue the conversation

Openly sharing destination data engages stakeholders in deeper conversations about the visitor economy and its impact on the community. Not only can local business owners use insights to inform their own strategies, but they can become powerful advocates for tourism and collaborators in developing new solutions to your challenges.

Here are a few additional tips from Zartico’s experts:

  • Showcase examples of how you’ve used data to drive strategy in campaign planning, product development, or investment decisions.
  • Invite your stakeholders to share their stories with you. How have they used the information you provide?
  • Connect your stakeholders to industry news and trends to place your data points into a national or global context. (Zartico clients can find the latest trends roundup in the Resources library.)

Data opens doors — and the destinations welcoming the greatest possibilities for their communities are ones seeking creative ways and places to share their stories.


Insights from the Zartico Destination Operating System® (ZDOS®) fuel data-driven conversations within destination organizations and with their communities. Contact our team to see these insights in action.