Metrics That Matter
Powering Smarter Performance
Turn Insights Into Action
Zartico’s DCO and Agency Connect Feed deliver unmatched transparency and real-time intelligence for media agencies looking to optimize their campaigns based on actual visitation data—not just clicks or impressions.
By integrating directly into an agency's analytics environment, our feed empowers you to more efficiently and effectively use conversion-based signals for media optimization, market optimization and elimination of ad waste.

Why It Matters
- Evaluate campaign success based on actual visitation and behavior.
- Compare vendor efficiency and effectiveness by measuring the conversion rate.
- Adjust in-flight campaigns using real-time signals rather than waiting for a wrap report.
- Seamlessly integrate data into existing media performance dashboards and reporting.
- Receive board-level reporting post-campaign while maintaining access to the data throughout.

What’s Inside DCO and the Agency Connect Feed?
Our structured, machine-readable data is delivered weekly and integrates seamlessly with your analytics stack. Data includes:
- Impression-to-Visit Attribution – Understand which ads and placements drive real-world traffic.
- Conversion Rate - Easily compare vendor, market and medium performance for campaign planning and optimization. Establish internal performance guidelines and benchmarks across your portfolio of clients.
- Because we’re extra: Expect the highest match rate with Zartico’s non-biased, full coverage mapping technology!
- Conversion Window – Track how long it takes for an exposed audience to convert into visitors to understand whether low, medium or high-funnel activities are converting as intended.
- Market & Audience Insights – Compare performance across geographies and behavioral segments and gain insight into key consumer behaviors.
- Vendor Efficiency – Pinpoint which partners deliver the best value per conversion.
- Location-Based POI Correlation: - Get direction as to how your audiences are behaving in-destination.
Unique Performance Calculations for Smarter Decision-Making
Perform additional analysis or modeling by combining DCO and Agency Connects data with cost and performance data from your ad servers or in-house data stores. Build your own custom calculations from our raw data to uncover hidden patterns and opportunities.
Simple Metric Descriptions
Market Conversion Share
See which markets really matter
Shows you what percentage of your total conversions come from each market. This helps you understand if a market with a high conversion rate is actually delivering meaningful results or just a tiny fraction of your total conversions.
Example: A market might convert at 10%, but only account for 0.5% of all conversions—meaning it might not be worth additional investment.
card-link-1Vendor Conversion Share
Know which vendors deliver visitors
Reveals what percentage of your total conversions each vendor is responsible for. This helps you identify which vendors are truly driving meaningful results versus those that might have high rates but low overall impact.
Example: Vendor A might have a 5% conversion rate but deliver 40% of your conversions, while Vendor B has an 8% rate but only 3% of total conversions.
card-link-2POI Visitation Patterns
Intelligence for how ads influence visitor behavior
Compare where ad-exposed visitors go versus non-exposed visitors across different POI categories and regions. See if your ads are effectively driving traffic to restaurants, retail, attractions, or accommodations showing movement by region and by category, without the ability to filter categories within specific regions. No gaps, no self-select mapping bias. With Zartico, experience the clearest view through our advanced mapping technology— No gaps, no self-select mapping bias.
Example: Visitors who saw your ads might visit museums 28% more often or spend 40% more time in your entertainment district compared to those who didn't see your ads.
card-link-3Conversion Timeline
Track patterns in conversion flow over time
Shows how your conversions trend over days, weeks, and months. This helps you see if your campaign is gaining momentum or slowing down and reveals patterns in visitor behavior after seeing your ads.
Example: During the post-campaign analysis, you notice that conversions peak 46 days after campaign launch, helping you time your staffing and inventory decisions accordingly.
card-link-4Complimentary Solutions
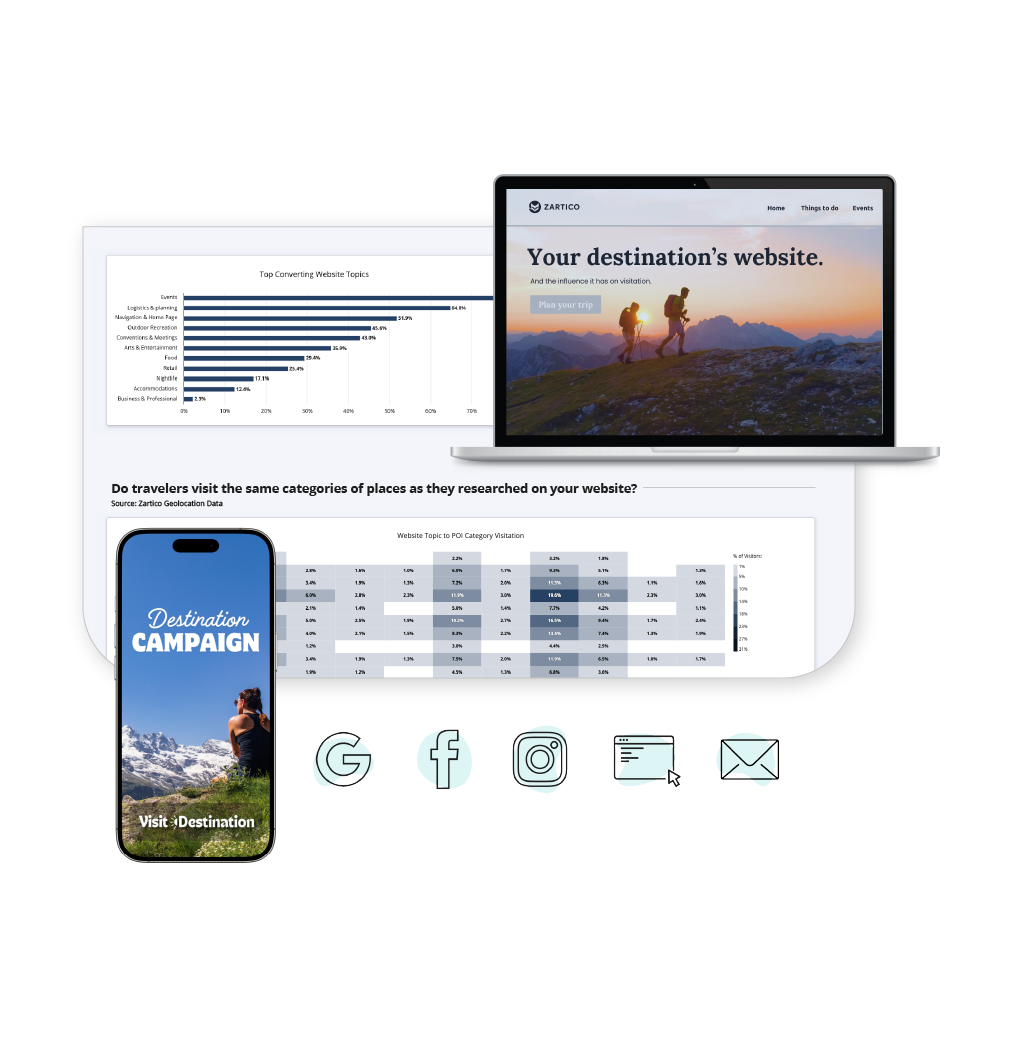
Website Attribution Closing the Gap on Walled Gardens
Many walled garden platforms restrict advertisers from directly measuring their campaign impact outside of platform-specific metrics. When you combine Zartico’s Website Attribution with our Agency Data Feed - we bridge this gap.
- Track Paid Media from Walled Gardens: Capture engagement data for Ads driving traffic to your website and understand whether those site visits turn into destination visits.
- Extend Attribution Beyond Clicks: By connecting web interactions to real-world visitation using geolocation tracking, we provide a full-funnel view of the traveler’s journey.
- Align Website Data with Visitor Behavior: Measure the true impact of social and search campaigns, even when those platforms limit direct conversion tracking.

Why Zartico?
Zartico offers fully transparent, cross-vendor attribution.
Our solution is:
- Advanced Geospatial Mapping: High-resolution mapping captures total conversions and removes the bias of self-select mapping.
- Vendor-Agnostic: We don’t sell media, so we’re unbiased in our reporting.
- Privacy-First: Powered by aggregated and anonymized geolocation data.
- Designed for Agencies: Easy ingestion for seamless integration into your dashboards.
Insights that fuel action and strategy
Impressions
- Validate early campaign performance.
- Balance impressions toward short- and long-term goals.
Conversions
- Who saw your ad then visited?
- Evaluate vendors and mediums for effectiveness.
- Identify markets responding best to your message.
Comparisons
- Compare ad-exposed and non-ad-exposed visitors to understand how your advertising is influencing visitor behavior.
- More effectively tell the story of how your campaigns influence quality visits.
Delivered to fit your marketing processes
Eliminate guesswork and fuel strategic action within your existing workflows.
For Marketers:
- Analyze near real-time ad delivery and performance metrics within your DCO Dashboard.
- Leverage performance insights that capture impact beyond your digital efforts with board-ready Campaign Performance Reports.
Agency Connect:
- Create and manage campaigns and pixels in Campaign Hub.
- Import ad data into your existing tech stack using the Agency Connect data feed for advanced modeling and insights.