

States have a fundamentally different role than city and county tourism offices. View your visitor economy from a macro statewide perspective while also diving into micro-level regional detail.

-1.png?width=500&height=218&name=Z-Light%20Black%20Logo%20(1)-1.png)
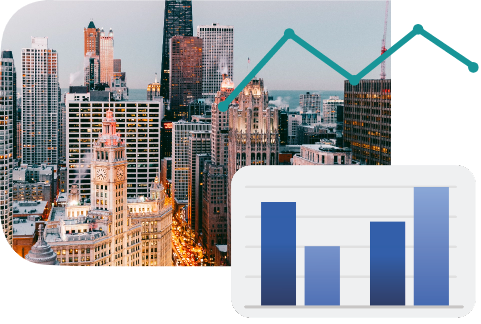
Focused reporting built for speed, ease, impact and sharing, to illuminate the value of your visitor economy.


Shine a spotlight on metrics that matter.
We built Z-Light to empower destination leaders who recognize the value of data-driven thinking and need reliable answers fast.
Access the insights you need at lightning speed.
Login any time to understand how you’re performing in a matter of minutes. See monthly insights that reflect your destination’s top-line performance.
Easily share reports with your board and stakeholders.
Export professionally designed reports with a single click. Give key individuals direct access with unlimited Z-Light user logins.
Report on the impact of your work within the community.
Strengthen your organization’s voice in local conversations by showcasing the value of the visitor economy. Rely on data — not assumptions — to know what’s really happening.

More than 250 destinations trust Zartico to deliver reliable insights that drive impact

.png)


Plug in to powerful data, backed by science.
Z-Light is designed for efficient, focused reporting — but there’s nothing lightweight about the data that powers these insights.
- Lodging Data: Visibility into overnight stays that fuel your visitor economy
- Spending Data: Understand how visitors contribute to local businesses
- Geolocation Data: Tell the story of how visitors experience your destination
- Website Data: Connect Google Analytics to visualize web traffic alongside KPIs
You can share these insights with confidence, thanks to Zartico’s data science methodologies that ensure quality and accuracy.
Ready to switch on data-driven reporting for your destination?
If you’re looking for a streamlined reporting tool that gives you focused visibility into your visitor economy, connect with our team to see Z-Light in action.